Management Reporting for Update Compliance
Microsoft Update Compliance [LINK] is a great free solution for monitoring the status of Windows Update installations on your Windows 10 and Windows 11 devices. Data is collected through telemetry and stored in a Log Analytics workspace.
Out of the box, the reports are functional, but hard to interpret if you are not a Windows Update aficionado. This is an example of the reports that you can obtain from Update Compliance.
Several problems stand out.
The report only shows information about the current update and the previous update
The update status graphs only report on the latest update
If you operate a series of update rings with delays then you will never see high levels of compliance on the graph
The screenshot above was taken on the day that new updates were released, which makes the graph look horrible. The average senior manager would see the report and demand immediate action because updates are not being installed.
I needed a simplified dashboard that shows an accurate picture of real-world compliance for reporting to senior management. The screenshot below is from a custom workbook that uses the Update Compliance data in the Log Analytics workspace to compile a management friendly snapshot. This dashboard replaced an Excel spreadsheet and cut an hour of workload a week on compiling management reports.
Key features include
A graph of compliance in N, N+1, N+2, Older that reflects delays with ring deployments
Breakdown of the OS build versions
Breakdown of the Feature Update versions
The N, N+1, N+2 graph requires some additional data that is not present in Update Compliance. I created a custom table in Log Analytics to allow a KQL query to enrich the data on the fly. A simple PowerShell script needs to be run whenever new updates are released to update the custom table.
I would like to credit Peter Van Der Woude for inspiring my dashboard. I borrowed his idea for a dashboard and re-used some of the queries he wrote. Peter’s original article can be found here [LINK].
The dashboard and the PowerShell script can be found in my GitHub repository [LINK].
Setting up the Enrichment Data
Carry out the following steps to add the enrichment data to your Log Analytics workspace.
Download the Set-CUVersions.ps1 PowerShell script and the JSON configuration file from GitHub. You will need to update the JSON file periodically when Windows Updates are released. The JSON in the repository is for the updates released up-to January 2022 (I may add updated JSON files occasionally in future).
Logon to portal.azure.com and open your Log Analytics Workspace. Click on Agents management. Make a note of the Workspace ID and Primary key.
Edit the Set-CUVersions.ps1 PowerShell script. Update the $LogAnalyticsWorkspaceID and $LogAnalyticsSharedKey values with the values from your Log Analytics workspace.
Run the PowerShell script using the following command to upload the data from your JSON file.
Set-CUVersions.ps1 -VersionFile <JSON file>
It takes about an hour for Log Analytics to create a custom table. Wait for a while to allow the data you uploaded to be processed. The queries use the most recent data so running the script multiple times will have no negative impact.
Deploying the Dashboard
Carry out the following steps to deploy the dashboard to your Update Compliance Log Analytics workspace.
Download the Update Compliance Snapshot.workbook file from GitHub.
Logon to portal.azure.com and open your Log Analytics Workspace. Click on Workbooks then click the New button.
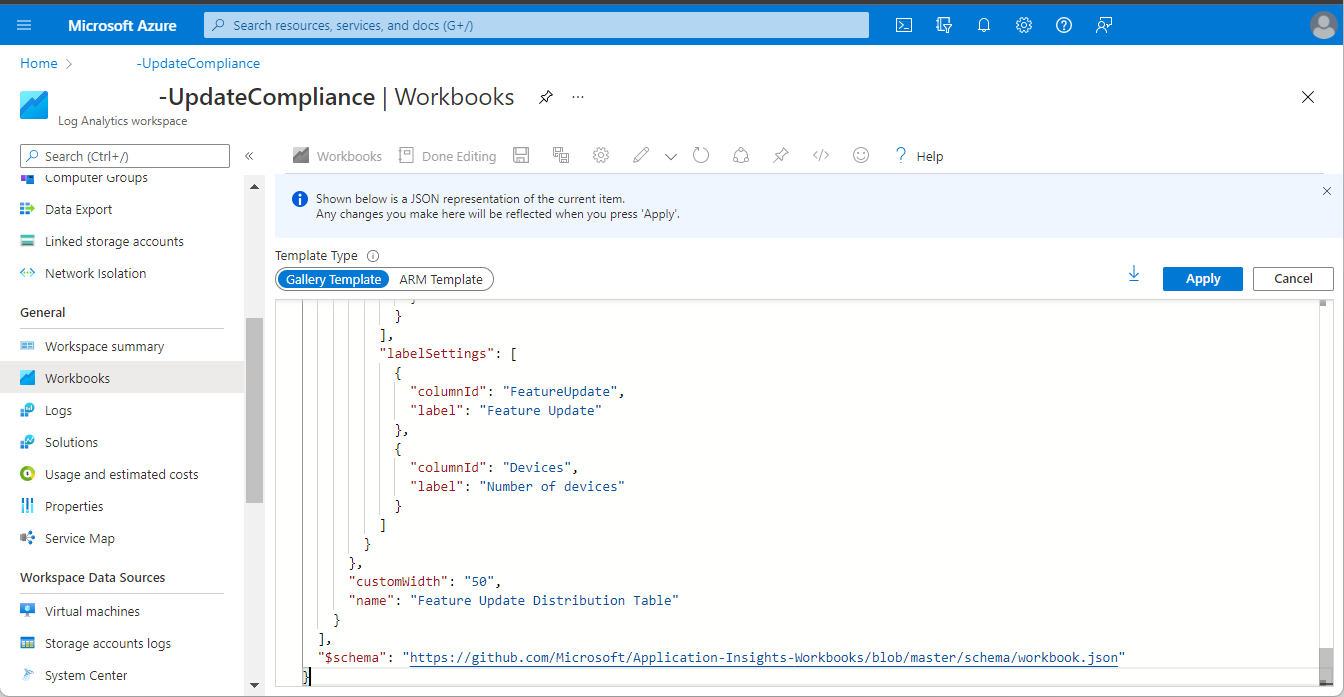
Click on the Advanced editor button on the top bar of the editor.
Replace the contents of the gallery template with the contents of the Update Compliance Snapshot.workbook file and click Apply.
Save the workbook then click Done Editing. Share the workbook with your colleagues and send screenshots to your Information Security Manager.


